Gantt Chart: The Essence and Nuances of Its Use
Mastery in project management stands as a pivotal element in fostering business growth and the execution of intricate, or even straightforward, structural undertakings. Numerous instruments have left their mark on project structuring. Among these, the Gantt chart shines as one of the most influential. So, what exactly is a Gantt chart? It takes the form of a visual strategy for orchestrating and supervising projects. Within contemporary business planning and project management landscapes, the Gantt chart has risen to represent the very pinnacle of effectiveness.
Who Is Gantt, and What Does the Chart Have to Do With It?
The Gantt chart has been known for over a hundred years. It was developed by Henry Lawrence Gantt, an American scientist and engineer. His generation was faced with the need to manage time and resources in large manufacturing enterprises, which began to develop rapidly in the early twentieth century. Gantt, in turn, worked to optimize project management in British factories. Already in 1910, he understood that effective planning and management of work at all stages were key aspects of success. Later, Gantt published an article entitled “Work, Wages and Profits” in which he presented his method of project management. This was the first step towards the spread of the Gantt chart as a management tool.
Few people know that Henry was not the only inventor of this method. The foundation was laid by Polish engineer and economist Karol Adamiecki. He proposed the harmonogram or Adamiecki chart. This is a graphical method of analysis and planning. Despite the fact that the Adamiecki chart did not become a universally recognized methodology, Henry Gantt used its developments to develop a graphical method of planning and control.
Hence, the Gantt chart encapsulates his engineering mindset. It materializes as a technique that translates the tasks within a project into columnar entities along a chronological axis. Each task, demarcated by its initiation and culmination dates (or designated time frame), finds its place along a horizontal timeline. Henry, in his foresight, envisioned this as a tool to enable engineers and managers to grasp a visual narrative of project advancement. It adeptly captures the precise moments when tasks reach fulfillment and facilitates the identification of trends inherent to the project’s progression.
Theory and Benefits
Within contemporary businesses, the Gantt chart has evolved into an immensely favored online instrument. Its reputation as a steadfast frontrunner in digital project planning owes itself to an array of advantages bestowed upon its users:
- Visualizing Projects: Crafting an online Gantt chart facilitates the visual representation of project phases and assignments, aligning them seamlessly with temporal investments. This visual medium empowers both the team and stakeholders to readily grasp the chronological progression of tasks, their interconnection, and the overarching trajectory of project realization.
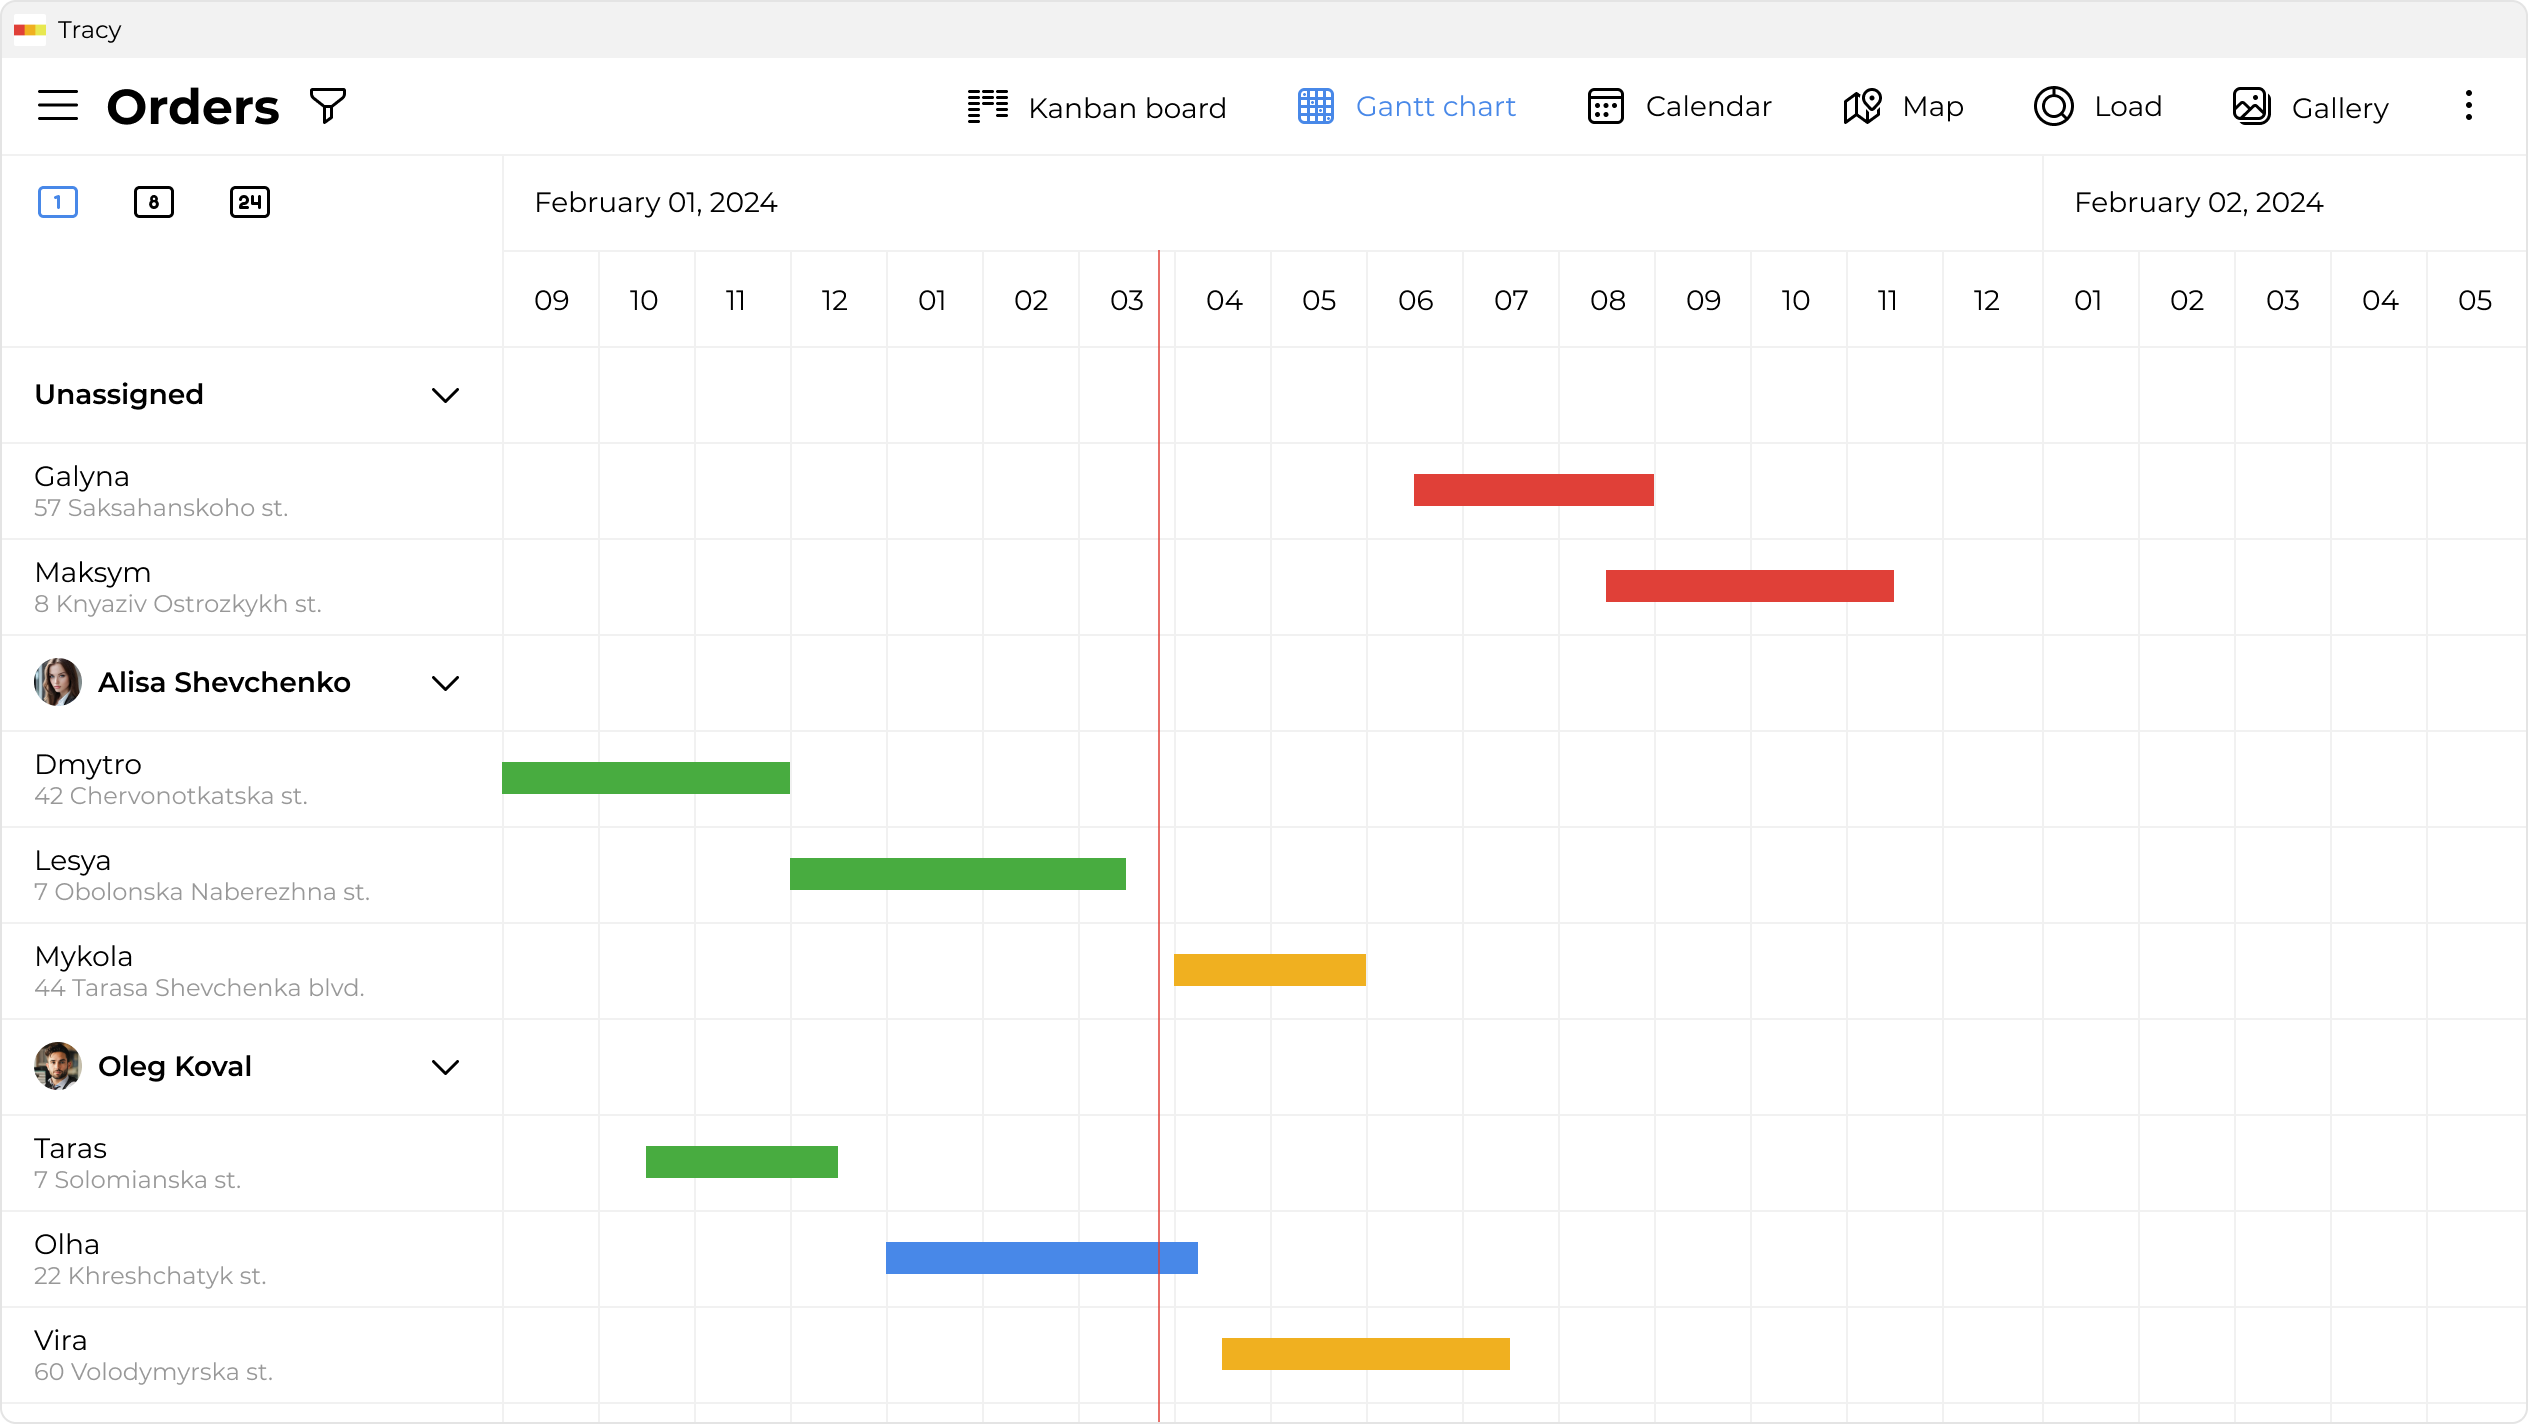
- The Chart Is Easy to Use. Creating and interpreting a Gantt chart is easy, even for those who have not previously managed a project. Columns, tasks, and costs make the information intuitive. Online Gantt charts can vary in terms of functionality, so it’s important to choose the right tool. Tracy can be easily adapted to any purpose, or you can use ready-made templates, including those for your business.
- Dependency Management. With a schedule, you can quickly identify interconnection between tasks. In project management, this helps to take into account which tasks need to be completed in order to continue with other tasks.
- Monitoring Progress: Upon project initiation, the Gantt chart presentation serves as a dynamic tool for tracking its evolution. As tasks are accomplished, they receive distinct markings, vividly indicating their completion status and contributing to comprehensive project monitoring.
- Optimizing Resource Allocation: The Gantt chart provides a platform to allocate resources, offering a visual framework to enhance resource utilization and efficiency. This, in turn, alleviates employee workloads, streamlines resource deployment, and mitigates the peril of overlooked tasks or deadlines.
- Transparency of Communication. Visualization of project progress simplifies communication within the team, with clients, and with the manager. Everyone sees the big picture, understands the priority of goals, the workload of each employee, and the overall progress of the project.
- Deadlines. Thanks to the schedule, you can set realistic deadlines for tasks and projects, monitor how well employees are doing on time, where problems may arise, and how to prevent them. The Gantt chart allows you to manage time frames more precisely.
- Distribution of Responsibilities. With the Gantt tool, you can more effectively distribute tasks among team members and identify who is responsible for completing them. Tracy pays special attention to the roles of team members, which you can read about here.
- Risk Assessment. By visualizing and exhibiting interconnection and timelines, the Gantt chart equips project managers with the acumen to pinpoint potential risks and stumbling blocks within project execution, fostering a proactive approach to risk analysis.
- Presentation. The Gantt chart is also convenient for creating presentations and reports on the work done. With it, you can clearly demonstrate the current state of the project, plans, and prospects. In Tracy, you can control the time period yourself.
Strategies for Using This Project Tool
There are several strategies for using a Gantt chart for project management. Try implementing them step by step to understand which system is right for your business objectives.
Traditional Strategy
It involves creating a Gantt chart before the start of the project, when all tasks are divided into separate time bands. The traditional approach makes it possible to visualize the project from the start and provides an overview of the tasks and dependencies between them.
Incremental Planning
The strategy involves dividing the project into separate phases or iterations. A separate Gantt chart is created for each phase, so that the project manager can plan the tasks within each stage of the project in more detail. This strategy of using the tool will be especially convenient for teams that work in sprints.
Reverse Planning
As the name implies, the strategy involves starting with the tasks that are necessary to complete the project. Then, in the reverse order, dependent tasks are identified. The specificity of the Gantt chart allows you to determine more precisely when to start and finish each task.
Using the Gantt Chart Effectively
How do you build a Gantt chart to get the most out of the tool? First, you need to determine for yourself what your goal is with the method, and then read our tips:
- Achieve Comprehensive Task Enumeration: Precisely enumerate all imperative tasks inherent to the project’s scope.
- Unveil Task Dependencies: Identify tasks necessitating antecedent completion, ensuring task closure hinges on confirmed fulfillment.
- Refine Goals for Enhanced Control: Subdivide ambitious objectives into more manageable segments to bolster project oversight.
- Embed Accountability and Deadlines: Embed deadlines and task ownership to fortify project management; ensure timely progress tracking.
- Dynamic Adaptation for Real Progress: Modify as required to mirror authentic advancement, facilitating congruence with actual progress.
- Foster Collaborative Monitoring: Leverage the online Gantt chart to foster team-wide engagement in progress monitoring, granting a holistic view.
- Streamlined Workflow Enhancement: Opt for a tool enabling Gantt chart creation, updates, and sharing, streamlining workflow optimization.
- Flexibility in Response: Embrace the dynamic nature of Gantt charts; accommodate shifts, new tasks, or altered conditions with fluid adjustments.
Gantt Chart: Nuances and Problem-Solving
Despite its many benefits, using a Gantt chart can have some challenges and nuances for the team.
Lack of Flexibility. The Gantt chart is created based on the initial project plan and can sometimes be difficult to adapt during implementation.
The answer to the challenge: a tool where you can easily configure options, add data, and make changes.
Problem With Communication Within the Team. If the Gantt chart becomes too complex, it can become less visual and understandable for stakeholders, which can make communication difficult.
The answer to the challenge: the finished diagram should be clear and legible, not requiring detailed and lengthy explanations. You can also set up access to data so that executives see only the information they need to complete their tasks. You can read more about this here.
Inadequate Task Detailing. While a Gantt chart furnishes an overarching view of tasks and their temporal allocation, it might fall short in encompassing intricate particulars such as dependencies, resource allocation, subtasks, and other pivotal facets inherent to individual tasks.
The answer to the challenge: choose a tool that allows you to comment, add links, assign responsibility, set reminders, and select other options that are important for completing the task.
FAQ
What projects are best suited for using a Gantt chart?
A Gantt chart is most suitable for large and medium-sized projects with multiple interdependent tasks and stages. It helps visualize the schedule and deadlines, which is crucial for complex initiatives with a clear plan. Projects in construction, IT development, marketing, or event planning often use this chart. It is also useful in scientific research or any project that requires coordination between different teams. With a Gantt chart, it is easy to track progress and make adjustments when necessary.
How to properly define dependencies between tasks?
Dependencies between tasks are defined by the logic of their execution — one task must be completed before another can start. These dependencies can be: start-to-start, finish-to-finish, start-to-finish, or finish-to-start. Correctly defining dependencies helps avoid confusion in the schedule and plan resources properly. It is also important to consider the priorities of tasks and their impact on other stages of the project. To do this, it is helpful to discuss the plan with the team and clearly define the connections between stages.
How does a Gantt chart help avoid missed deadlines?
A Gantt chart provides a clear view of the timeframes and deadlines for each task. It helps visualize when tasks overlap or when potential delays might arise. This allows adjustments to the plan in advance, such as reallocating resources or changing priorities. The visualization helps the team understand which stages need to be accelerated or where issues may occur. As a result, the Gantt chart helps keep the project within the established timelines.
What online tools are best suited for creating Gantt charts?
Popular online tools for creating Gantt charts include Trello, Asana, ClickUp, Monday.com, and TeamGantt. These platforms offer an intuitive interface and visual panels for project planning. They allow easy creation, adjustment, and tracking of tasks, as well as configuring dependencies. All these tools have collaboration features and integrate well with other systems. Many of them offer both free and paid versions, allowing you to choose the best option based on your needs.
How often should a Gantt chart be updated?
A Gantt chart should be updated as the project progresses and timelines or tasks change. This could be a daily or weekly update, depending on the scale and dynamics of the project. Updates are essential to maintain the relevance of the plan and adjust the schedule when unexpected changes occur. They also help quickly identify delays or problems. Regular Gantt chart updates contribute to effective monitoring and control of the project.
Are there alternatives to Gantt charts?
Yes, there are several alternatives to Gantt charts, such as Kanban boards or Scrum methods. Kanban boards, like Trello or Jira, focus on visually displaying the current status of tasks and their movement through different stages. Scrum involves dividing the work into sprints, where the team focuses on specific tasks within a short period. Other alternatives include flow diagrams or Agile methods for project management. Each of these approaches has its advantages depending on the project type and the team.
 Alina Tymofeyenko