Dashboards
A dashboard can aggregate and display data from one or more datasets at once. Unlike datasets, dashboards do not store data directly—they simply present it in a convenient way through representations.
This is useful, for example, to have a shared calendar that combines tasks, meetings, and deadlines from different sources. Or to see summary reports across all projects at once. Or to gather in one place everything assigned to a particular team member.
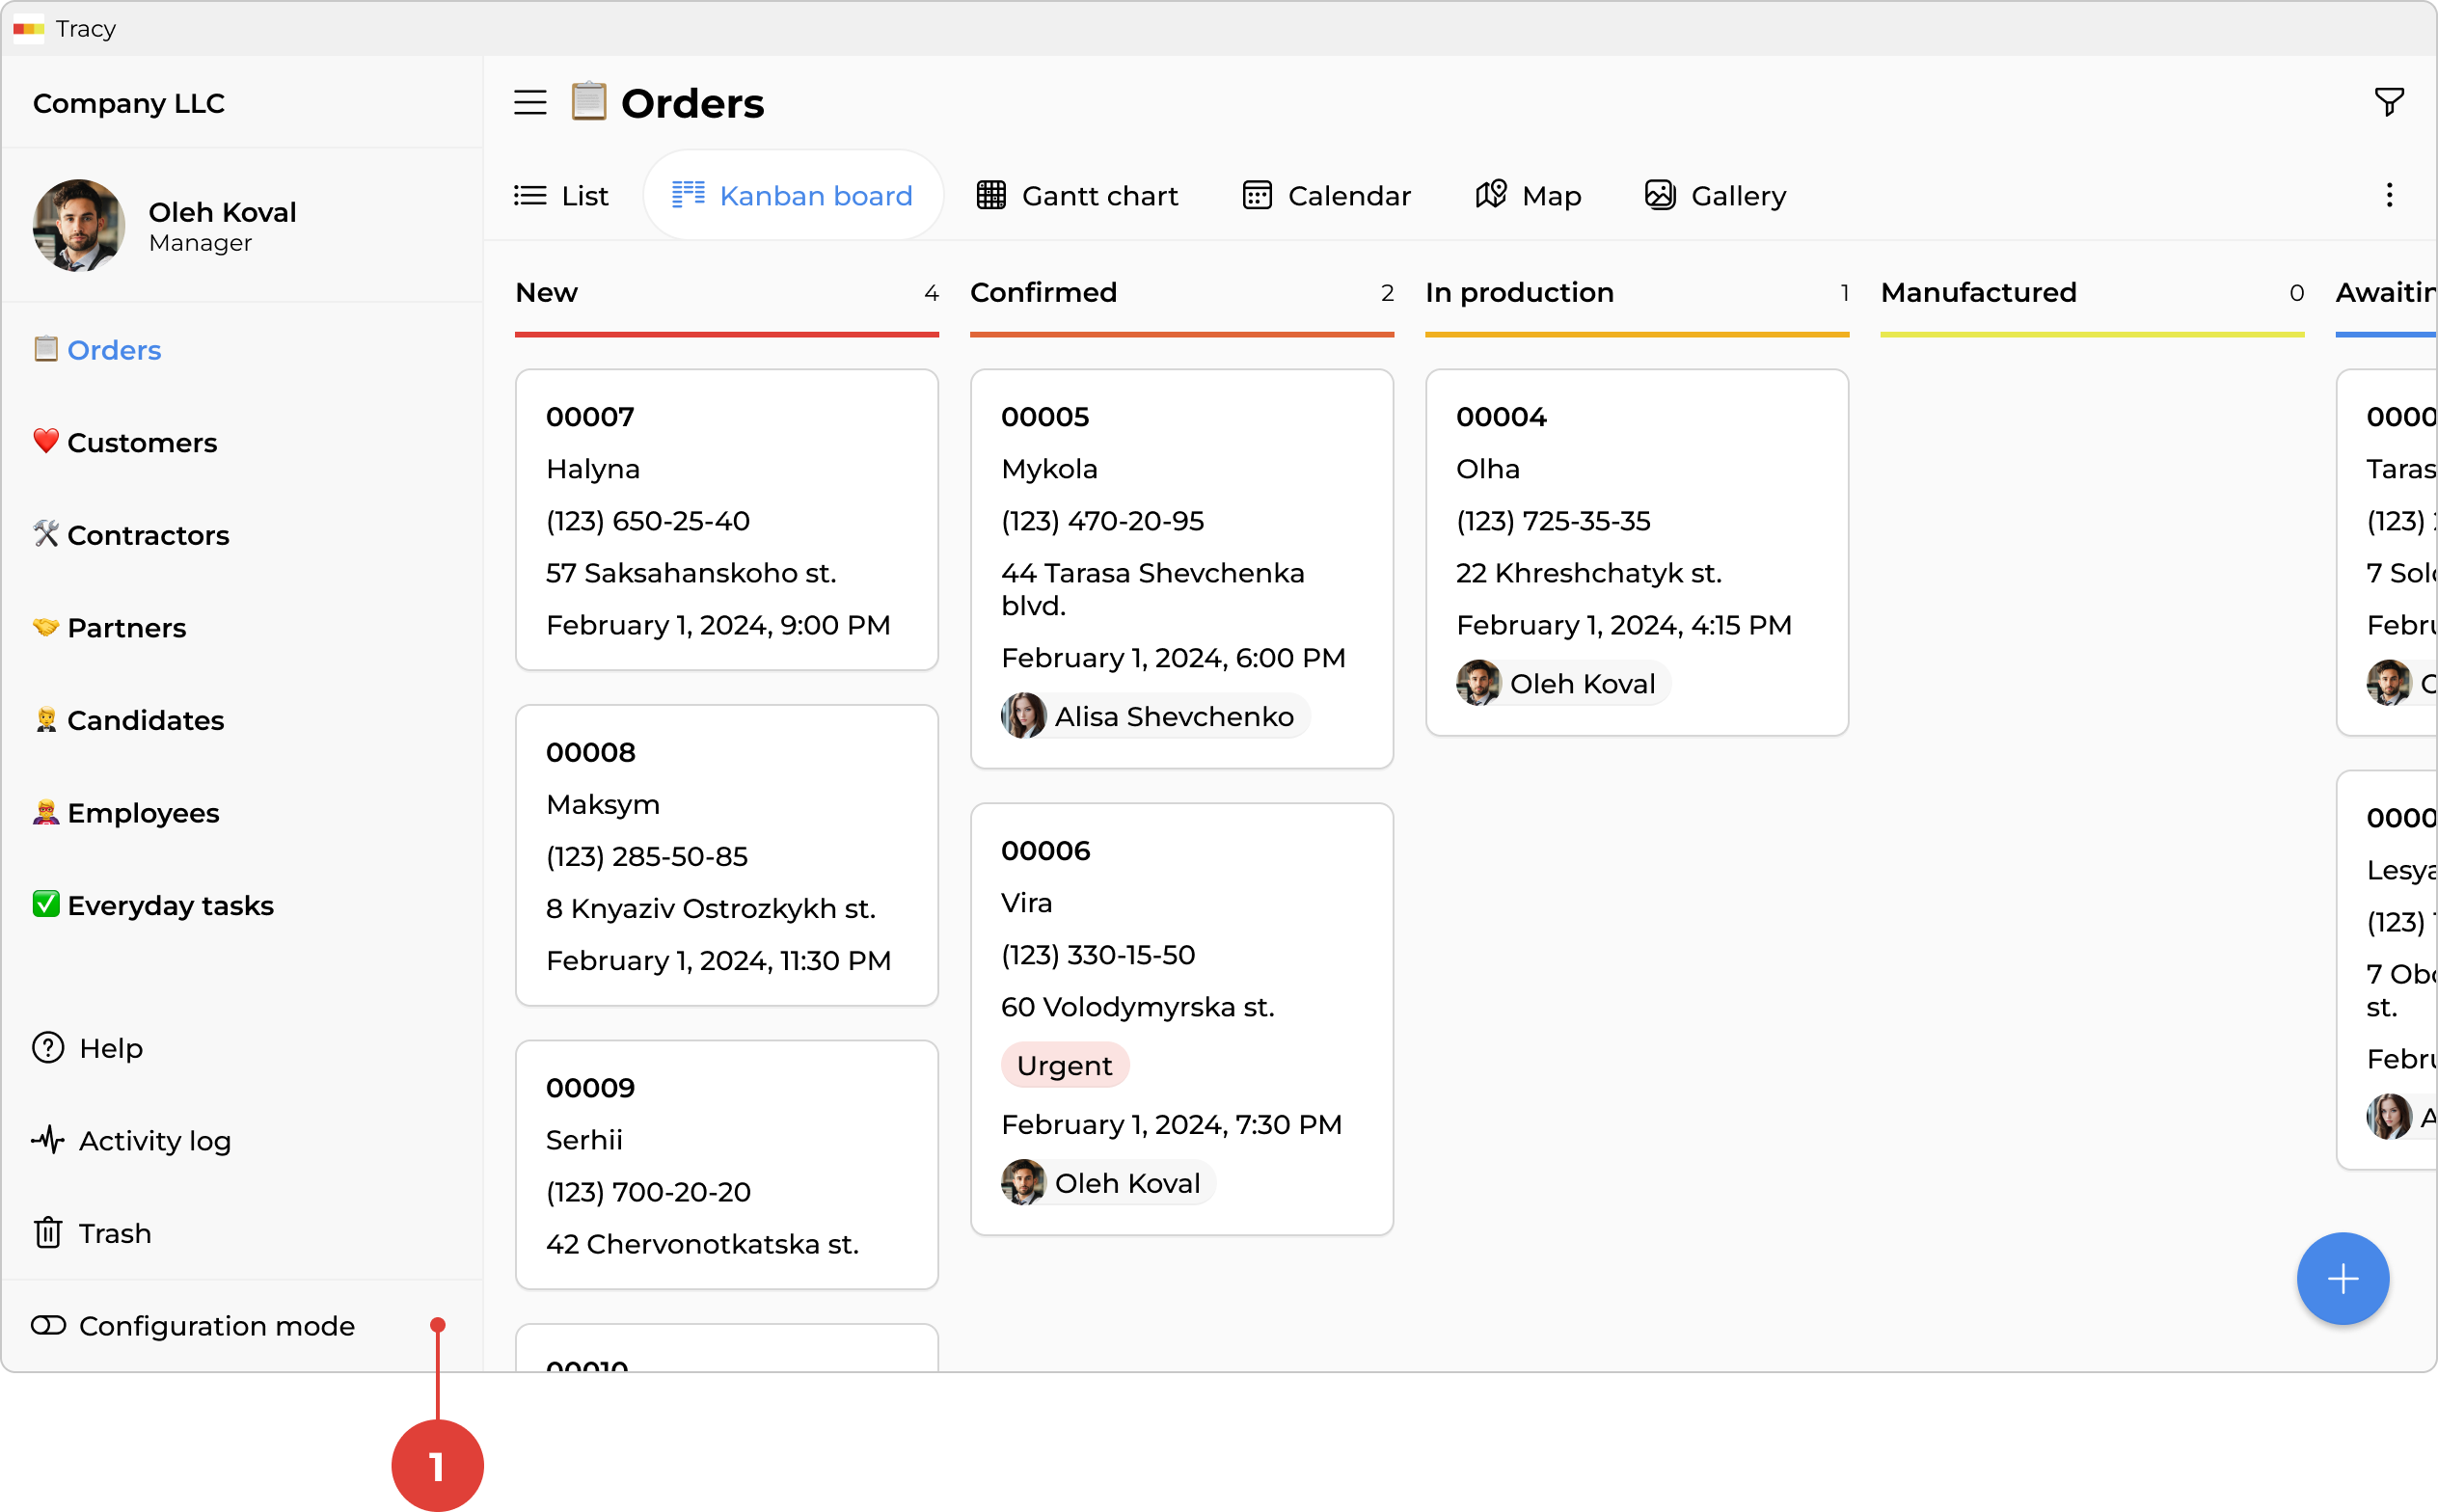
All dashboards are displayed in the catalog in the sidebar. To manage them, activate configuration mode by clicking the corresponding toggle ① at the bottom of the sidebar.
Adding a Dashboard
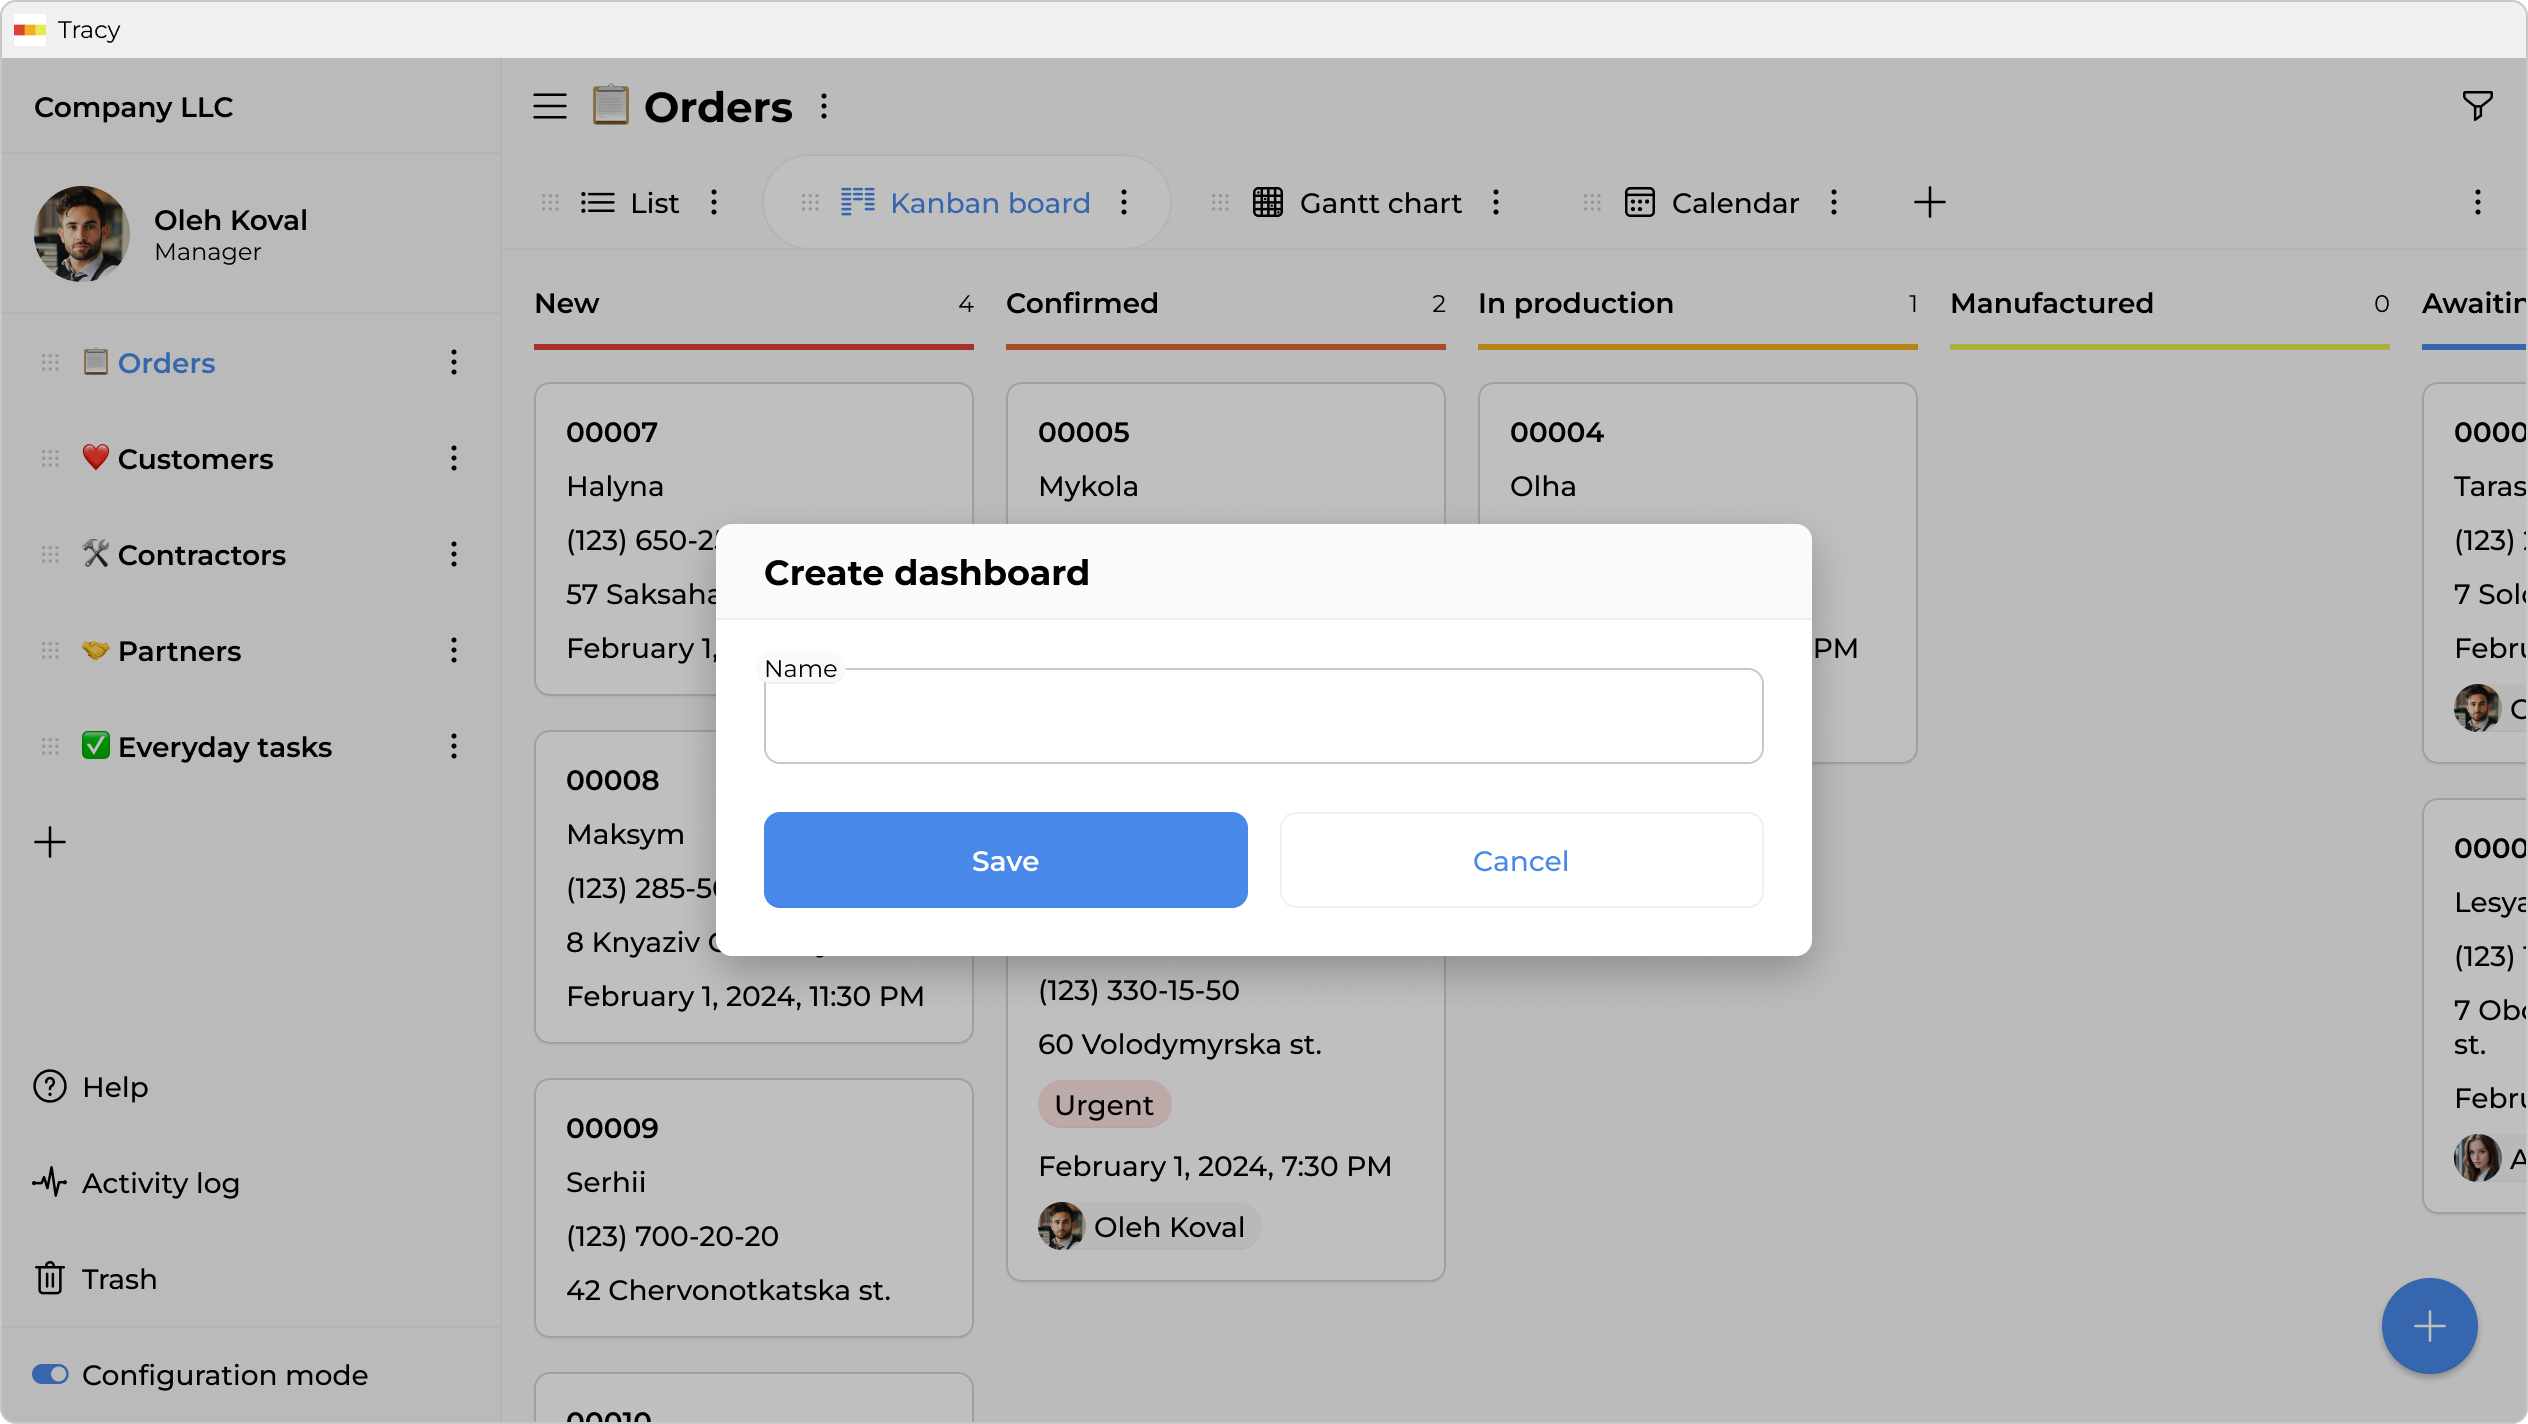
To add a dashboard, activate configuration mode, click the “+” icon ② below the catalog in the sidebar, and select the appropriate option from the context menu.
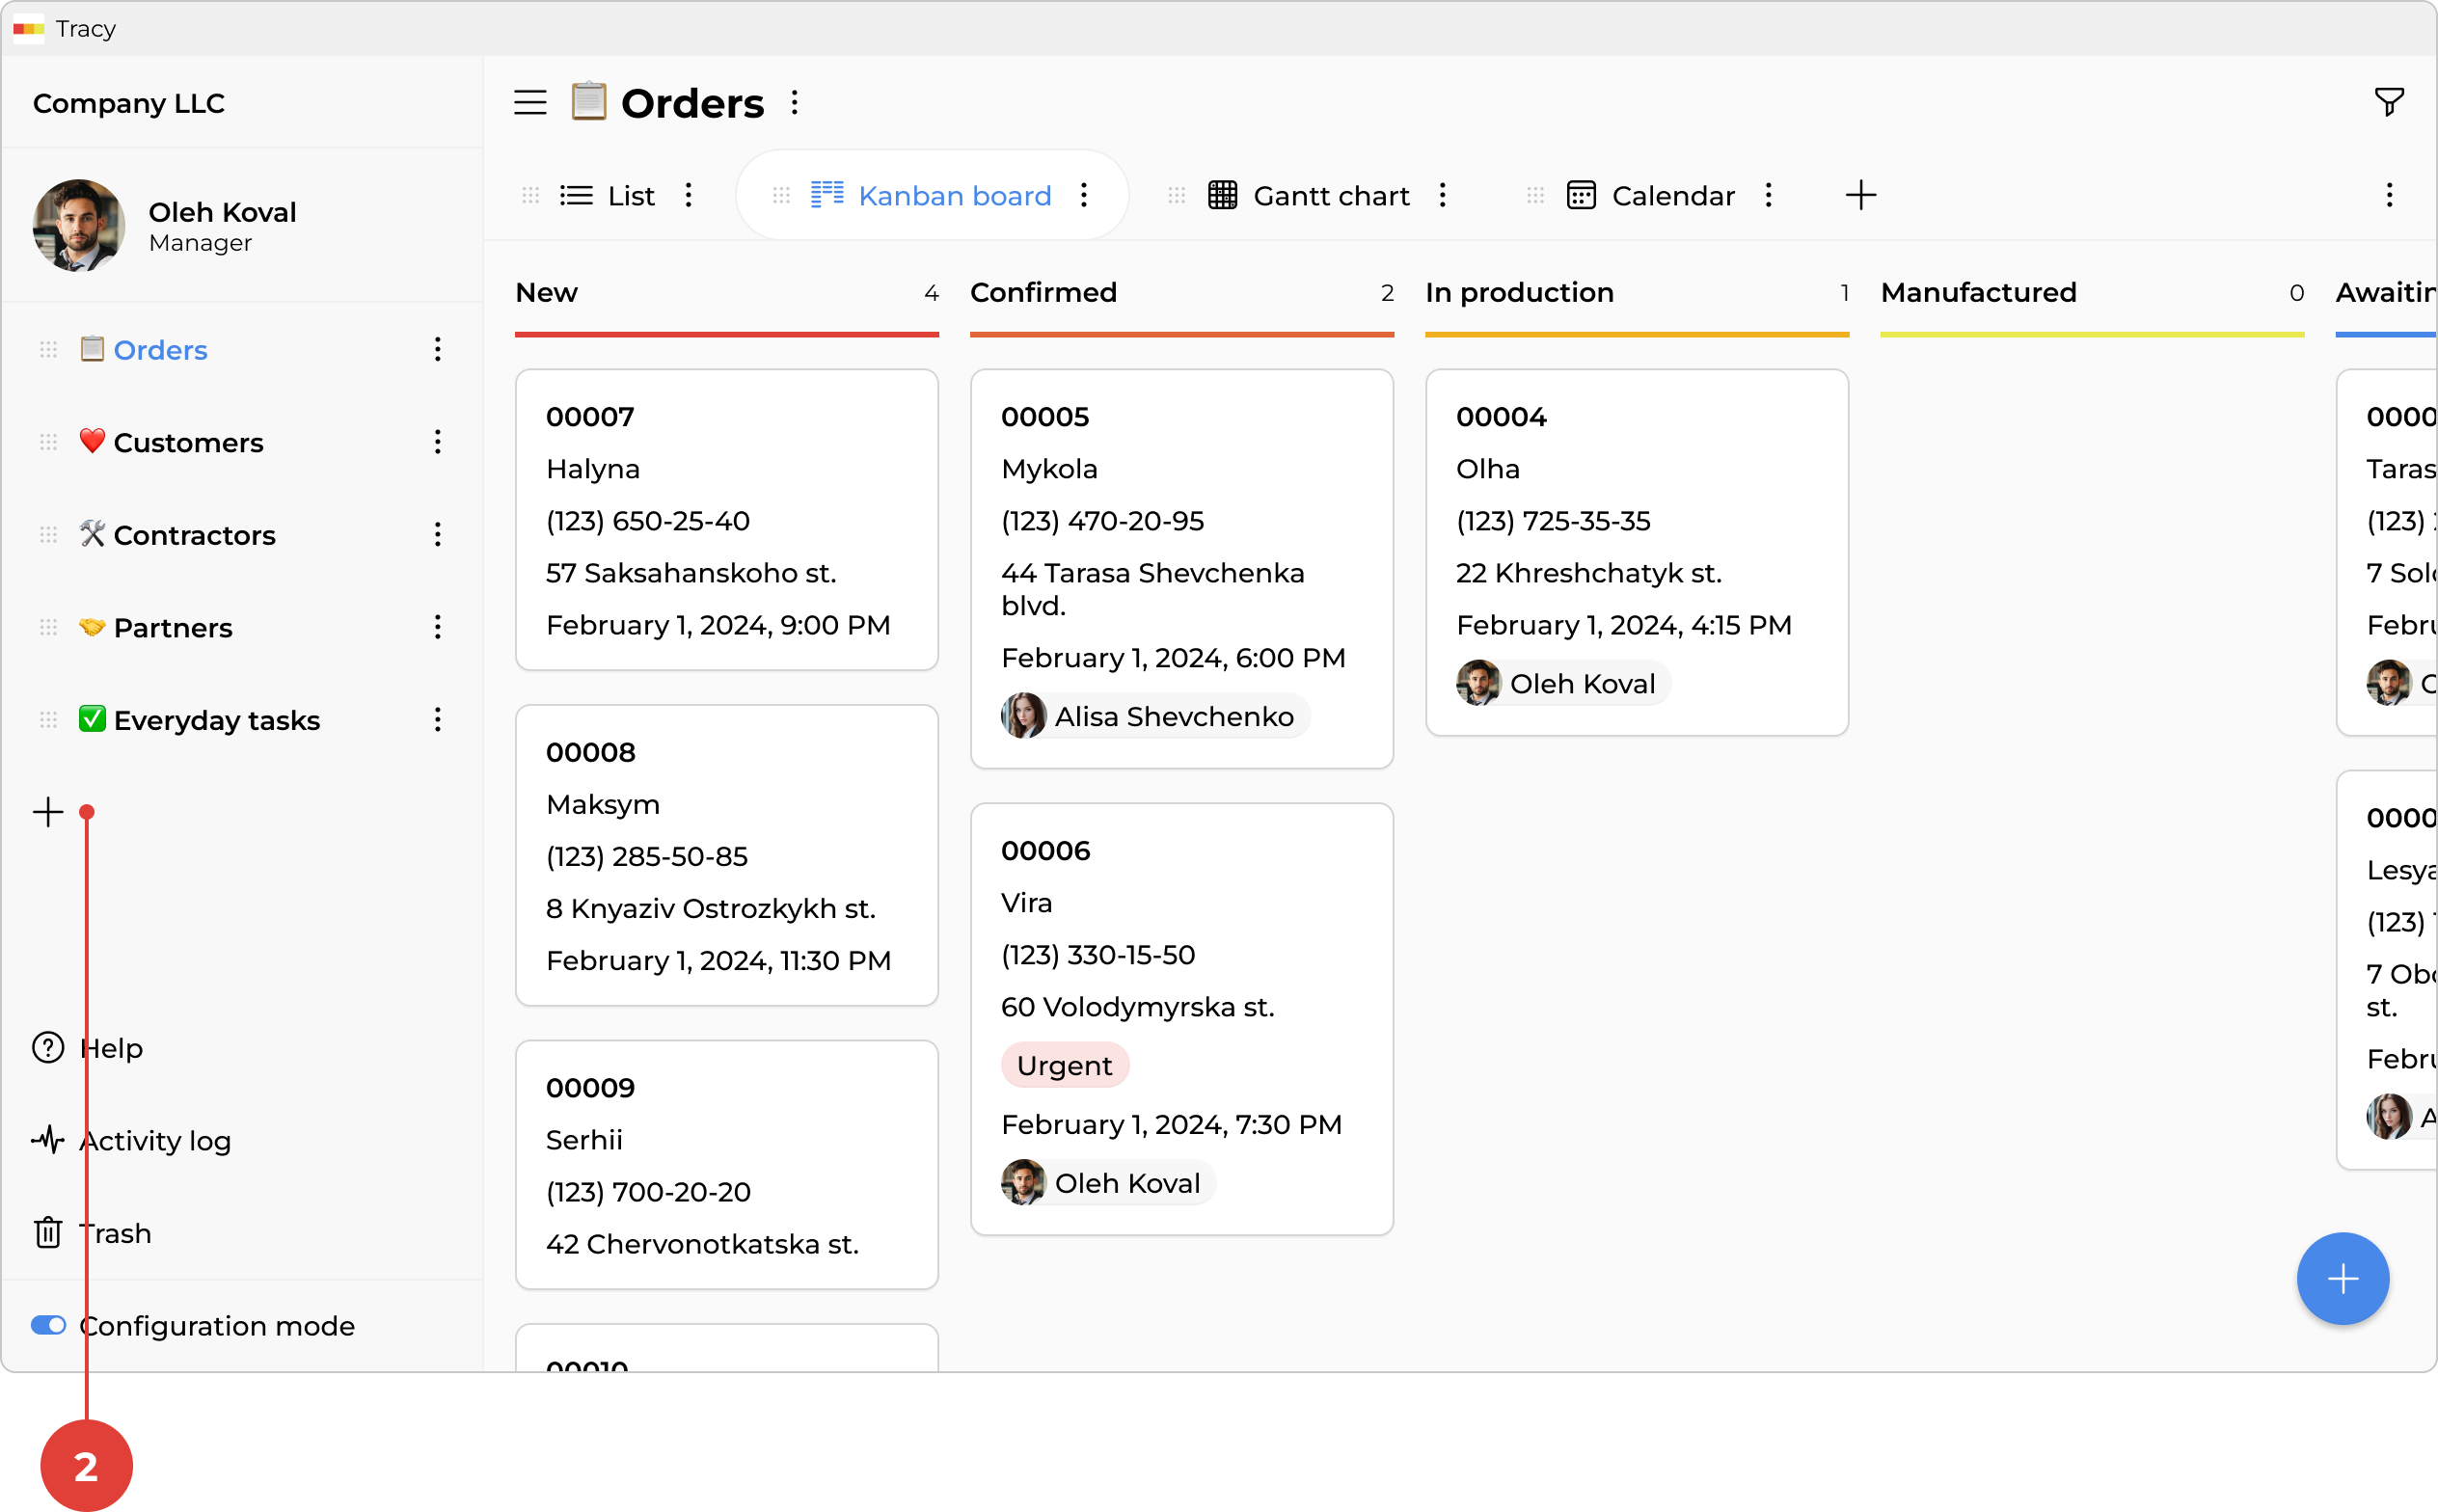
In the window that opens, specify the name of the dashboard and click “Save”. Once created, the dashboard will open immediately—you can start adding representations right away.
Managing Representations
Representations are managed directly in the main area. Open a dashboard, activate configuration mode, and go to the representation selector at the top of the main area—there you can switch between existing representations and add new ones.
Renaming a Dashboard
To rename a dashboard, activate configuration mode and select “Rename” from the context menu next to its name in the sidebar catalog or in the main area.
Deleting a Dashboard
To delete a dashboard, activate configuration mode and select “Delete” from the context menu next to its name in the sidebar catalog or in the main area.